社交网络发展图

来源:http://www.onlineschools.org/blog/history-of-social-networking/

社交网络发展图
来源:http://www.onlineschools.org/blog/history-of-social-networking/

What happened with the Internet in 2010?
How many websites were added? How many emails were sent? How many Internet users were there? This post will answer all of those questions and many, many more. If it’s stats you want, you’ve come to the right place.
We used a wide variety of sources from around the Web to put this post together. You can find the full list of source references at the bottom of the post if you’re interested. We here at Pingdom also did some additional calculations to get you even more numbers to chew on.
Prepare for a good kind of information overload. 
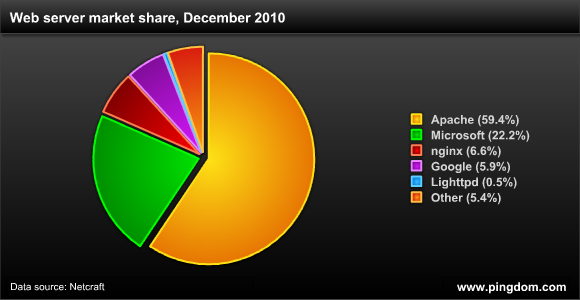
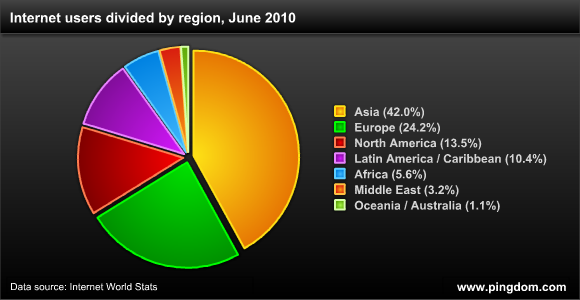
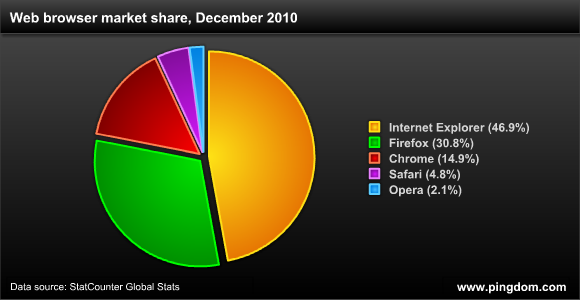
Data sources and notes: Spam percentage from MessageLabs (PDF). Email user numbers and counts from Radicati Group (the number of sent emails was their prediction for 2010, so it’s very much an estimate). Website numbers from Netcraft. Domain name stats from Verisign and Webhosting.info. Internet user numbers and distribution from Internet World Stats. Facebook stats from Facebook and Business Insider. Twitter stats from Twitter (and here), TwitterCounter and TechCrunch. Web browser stats from StatCounter. YouTube video numbers from Google. Facebook video numbers from GigaOM. US online video stats from Comscore and the Pew Research Center. Flickr image numbers from Flickr. Facebook image numbers from this blog.
我前几天在书社会做过一个调查:你偷过、窃过、撕过、剪过图书馆或者书店里的书吗?目前的结果如下:

参与的人没有我想象的多,Nalsi留言说看不太懂我的选项,但我还是要主观地认为很多人是有过此种行为的,因为我也是其中一份子。
读书的成绩不好,也许其中一个原因是我很喜欢看乱七八糟的东西,上小学和中学的时候,我经常看父亲的单位里的报纸,2X年前,北京发生了那个事件,过了没有多长时间,我就发现《光明日报》(印象中是,也许有误)用了100天,为前一年的那部红透中国的专题片《河@殇》(CCTV播出)挑了100个错误,那针针见血的评论让我一时摸不着头脑,……,也许鲁迅说的“痛打落水狗”就是这个姿态吧。
这种情形给了我一个好奇,那就是我特别想看看《河@殇》的全部解说词,可是在那种情形下,是很难实现的。接着批判《河@殇》的专著陆陆续续出来了,几年后我有一次在山东的某小型图书馆就发现了这么一本,印象中还不薄。让我特别高兴的是,这本书竟然有《河@殇》的全部解说词作为附录,我现在觉得这就是标准的“打着红旗反红旗”。我当时的第一意识就是要将这本书占为己有,现在已经忘记了如何谋划这个计划及诸多计划的不可实现可能,最终的结果是我将解说词用小刀给切下,偷偷带出了图书馆。
这个不道德的战利品让我兴奋了一小阵子,虽然现在它已不知何处,但这段记忆却无法在我的脑海中抹去。也许是因为上帝希望我救赎自己,所以让我后来做了图书馆员。
顺便说一下,几年前,我逛北大周末书市的时候,忽然发现了一本《河@殇论》(文化艺术出版社,1988年9月),定价2.45元,我用了6元买下。
P.S.现在孔子的塑像出现在我爱北@京@敏@感@词,我忽然想起了这个专题片及关于它的图书在我身上的印记。
Facebook的老板这两天在北京,贴出一个Digitalsurgeons推出的一张Facebook和Twitter的2010年数据对照图表,粗看一下除了Facebook有5亿用户遥遥领先于Twitter的1亿多一点之外,很多数据挺相近的,连男女比例都差不多,但两者的女用户都略胜男用户一筹。如果用户进行配对的话,会出现剩女。图表如下:

来源:http://www.digitalsurgeons.com/facebook-vs-twitter-infographic/
苹果商店现在已经有超过30万个app了,大约1/3是免费的。我所服务的机构本周也推出了苹果的第一个app,如有兴趣,请搜索“万方医学网”。下图是app of the day上发布的苹果商店的app数据图:

iPhone4上市后,我有个外地朋友想在香港买一台,但需要有一个香港地址接收,就向我求助,我正好有朋友在香港教书,于是乎我就做了个顺水人 情。当时是8月底9月初,他在苹果香港的网站上下了单,被告知4周后到货,原本他想9月中旬去香港出差顺带把手机带回来的愿望落空了,被迫改到国庆后。
我也眼热iPhone4,无奈我的一代运转正常,四代价格又不低,所以我没有更新换代的意思,甚至在网上写下我多么希望我的手机丢掉或者坏掉的酸葡萄话语, 结果9月中旬我的一代屏幕出了点小状况,由于多次地与地面亲热,一代的屏幕需要换掉,大约600元。我不舍得,于是想到了朋友香港的那部iPhone4。
我就和他商量,能不能先把iPhone4让给我用,因为国庆的时候,香港的朋友回北京。因为联通就要推出iPhone4了,要么买行货,要么再下单,晚点去 香港就ok了。朋友一口答应,no problem。真是好兄弟啊。
以下的故事就不是一个友情的故事了,而是我如何活活地把好兄弟逼成了祥林嫂。
国庆假期,如愿拿到了iPhone4,我的朋友也准备买行货了,可是他忽然发现无论是苹果店还是联通,都买不到了。但被吊起的胃口使 他又想起苹果香港网站的订购,反正要去香港嘛。可是香港网站竟然也缺货了。他又不想用高价买小贩的,估计这时候他开始念叨我了,口中一直在说:大意了,大 意了……
这时候,他开始泡论坛,得知大陆的苹果官网每天会放出一些,于是他就在晚上十二点等着下单,不料每每落空,徒留等待戈多。对付 mm,他手挺快,可是对付苹果,他就不灵了。
他愤怒了,每天发一条微博向我示威。我呢,无他,用温润的语言去抚慰他那受伤的小心肝。
从他下单到现在,三个月了,他的苹果依然是镜中月水中花,好浪漫的状态啊。
有人说,你这个朋友怎么这么贱啊,对,他的名字还就是叫“建”。
再说我身边两个朋友与iPhone4的暧昧,一个在联通预定,被告知需要等三个月;一个花了5800元在中关村买了一个16G的高价货,这个朋友叫什么牛来着,是挺牛,因为我的32G才5100多。
呼呼,知道偷着乐的赶脚了吧。
以上的故事有几个启示:
1、做人不要太执着了,不然会被人说成贱 人。
2、做事要学苹果,一个让人犯贱的公司。
3、不要做我的朋友。
苹果公司有多牛?看看下面这张图吧:
1、iPhone4上市三天内,销售了170万台。
2、苹果商店的应用程序超过30万种,已有超过70亿次 的下载量。
3、苹果为iPhone申请了超过200项专利技术。
……

图片来源:http://www.website-monitoring.com/blog/2010/11/30/iphone-facts-and-figures-history-specs/
Kindle不来中国了,他的中文名字金读暂时封存了,究其原因,官方说时机不到。是的,Kindle模式是我国电子书产业一直努力的方向,可是却一直走在有中国特色的礼品市场的路线上。如果打不通整个出版的产业链,Kindle及其所在的模式在中国将无法取得在美国的成功。懂得放弃的企业是一个成熟的企业。
刚才,看了一下Kindle的历史数据:
1 售价从399美元到现在的139美元。价格降下来了。阅读器的短板很多,但对于很多终端用户来说,价格是最重要的。我认为合理的价格是十本普通书的价格。对于美国用户来说,用139美金可能还买不到10本书。但对于中国的用户来说,500人民币以下才可能得到更多的市场。
2 图书的种类大大增加,从三年前的8万多种到现在的70多万种,而且涵盖了绝大部分的《纽约时报》畅销书榜上的图书。Leon的“容器说”我很赞同,“容”为先。
3 电子书的销量开始慢慢将纸本书的销量甩在后面。目前,每卖100本精装本的图书就能卖出143本电子书,也许两年后可能就是500本电子书。
图表转载如下:

来源:http://www.website-monitoring.com/blog/2010/11/14/kindle-facts-and-figures-history-specs/
今天看到译言网上有位叫苏吴男爵的网友将我先前贴出的《Twitter Facts & Figures (history & statistics)》翻译成中文了,转帖如下:


再转一个在中国是个传说的网站数据(这一个是Twitter,上一个是Facebook):
Twitter history, milestones, user & Tweet statistics, top 10 countries, top 20 users (most followed).
Information collected from multiple sources in April 2010. Some data may not be up to date.

来源:http://www.website-monitoring.com/blog/2010/05/04/twitter-facts-and-figures-history-statistics/
